Video and
Links
I will continue to add content to this website and particularly this page and
the evidence page specifically over the next few months.
During my journey of discovery by analyzing satellite imagery, I
stumbled into a number of links and videos that I found simply fascinating and
wanted to share with others. I also ran across videos I could not
adequately explain and videos that were instrumental in the formation of the
ideas I have presented here. I wanted to present a list of such links here
for others to enjoy and comment on.
First and foremost I owe a special debt of gratitude to the folks that built and
launched and maintain the
SOHO, TRACE and YOHKOH, CHANDRA
and Spitzer satellites.
This video by JPL shows the contents of our universe as seen in form various
wavelengths. These ideas about the
sun first began to form after watching countless hours of RAW EIT video that can
be downloaded by anyone from
here. All the RAW EIT (grey) images and video that can be found on
this website were downloaded directly from these archives and all still images
were extracted from the DIT files by copying a single frame using Quicktime.
I had a WONDERFUL conversation today, June 29th with
Dr. Oliver Manuel about his work on lunar
sample analysis.
Dr. Manual's work strongly suggests that the
sun is mostly made of
ferrite iron. I think his work is critically important and likely
provides all the math and nuclear chemistry analysis necessarily to support this
model fully. He has a
very detailed paper
explaining why the hydrogen model of the sun must be discarded based on nuclear
chemical analysis of lunar soil samples and comets.
Marvin Herndon's work on the
fission cores in
planetary bodies is first rate and may help explain the energy release of
the sun as well.
A unified field theory can now be constructed around the idea that our universe
sits within an electromagnetic field that is constantly accelerating the
universe itself. I believe (though my math skills are rusty) that the math
to demonstrate the idea that gravity is a function of acceleration has already
been put forth by others. I will research this and attempt to provide
links. Stay tuned.
Frank
Makinson (BS EE '58) (One of the old guys) from Springville, CA
totally blew my mind. I think someone with far better math skills than me,
needs to seriously consider the implications of this work.
If you are looking for
Hydrogen-Alpha (Ha) filters for your telescope to study where all the
action is happening on the sun,
Greg Piepol has a very nice website
devoted to this particular filter and is quite knowledgeable about the
technical ins and outs of using such filters.
I would also like to thank the folks at Lockheed Martin for all their hard work
and video as well.
NASA's Trace satellite routinely captures excellent
daily images of the
"crusty" surface of the calcium layer at 1550-1700 angstroms.
Over the past month or so I have also received some
wonderfully supportive emails including one from Andres R. R. Papa who is doing
some interesting work with
threshold systems as it relates to solar storms. I believe that a
solid, electrically conductive surface model of the sun supports his work
in a big way. Thanks for your encouragement! I also believe that his
vital work holds the key to understanding weather patterns on earth.
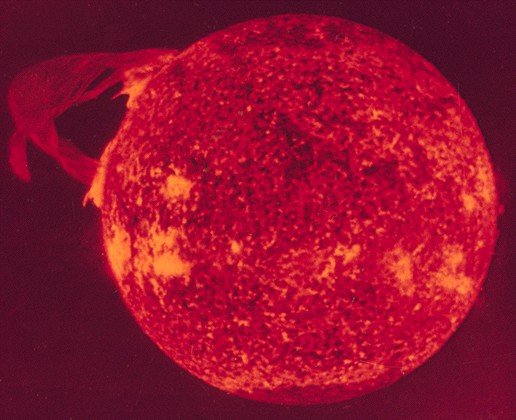
This particular video demonstrates the very fluid-like nature and odd
behavior characteristics of the
photosphere in remarkable detail IMO. I personally found this footage simply fascinating.
Dr.
Alexander G. Kosovichev, from Stanford University, and
Dr. Valentina V. Zharkova from Glasgow
University have already demonstrated evidence of
seismic activity using data collected by the
Michelson Doppler Imager onboard the
SOHO spacecraft following a flare
on July 9, 1996. This evidence of seismic activity led me to create and
work on the tsunami page of this website. I think their work also supports
the notion that the plasma in the photosphere acts with very much like a
"liquid" in many ways. This liquid like behavior is also evidence by the
granular nature of the surface of the photosphere.
Dr.
Alexander G. Kosovichev, from Stanford University also
created a wonderful illustration of the heat flow
within the photosphere that I found extremely helpful in understanding the
makeup and function of the photosphere. In fact his two videos were
instrumental in helping me understand the "texture" and "properties" of the
photosphere.
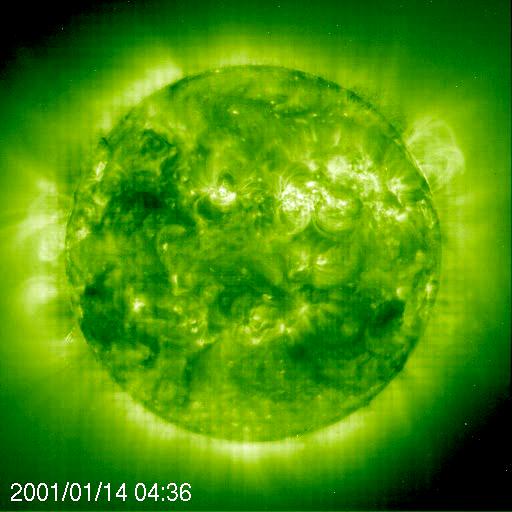
During the uncounted hours I spent in front of my computer
monitor watching raw EIT images and green processed EIT images,
I ran across a phenomenon from January 10th
through January 14th of
2001 that occurs
repetitively but also quite infrequently. In upper polar region and in
the upper left corner of
this processed green EIT video can be seen a "fluid-like" plasma that builds up
within the photosphere and then "lifts off" or "burns off"
or "evaporates off" from the surface in a
truly massive eruption. I'm guessing that this is nickel plasma building
up from the surface erosion process, but if you have any
better suggestions, I'm all ears. To adequately see the range of things
that are happening, you may want to review all the EIT videos from January
10th,
11th,
12th,
13th and
14th of 2001 as a continuous loop. The unprocessed
"grey" videos are equally
interesting but the phenomenon is most visible in processed green videos IMO.
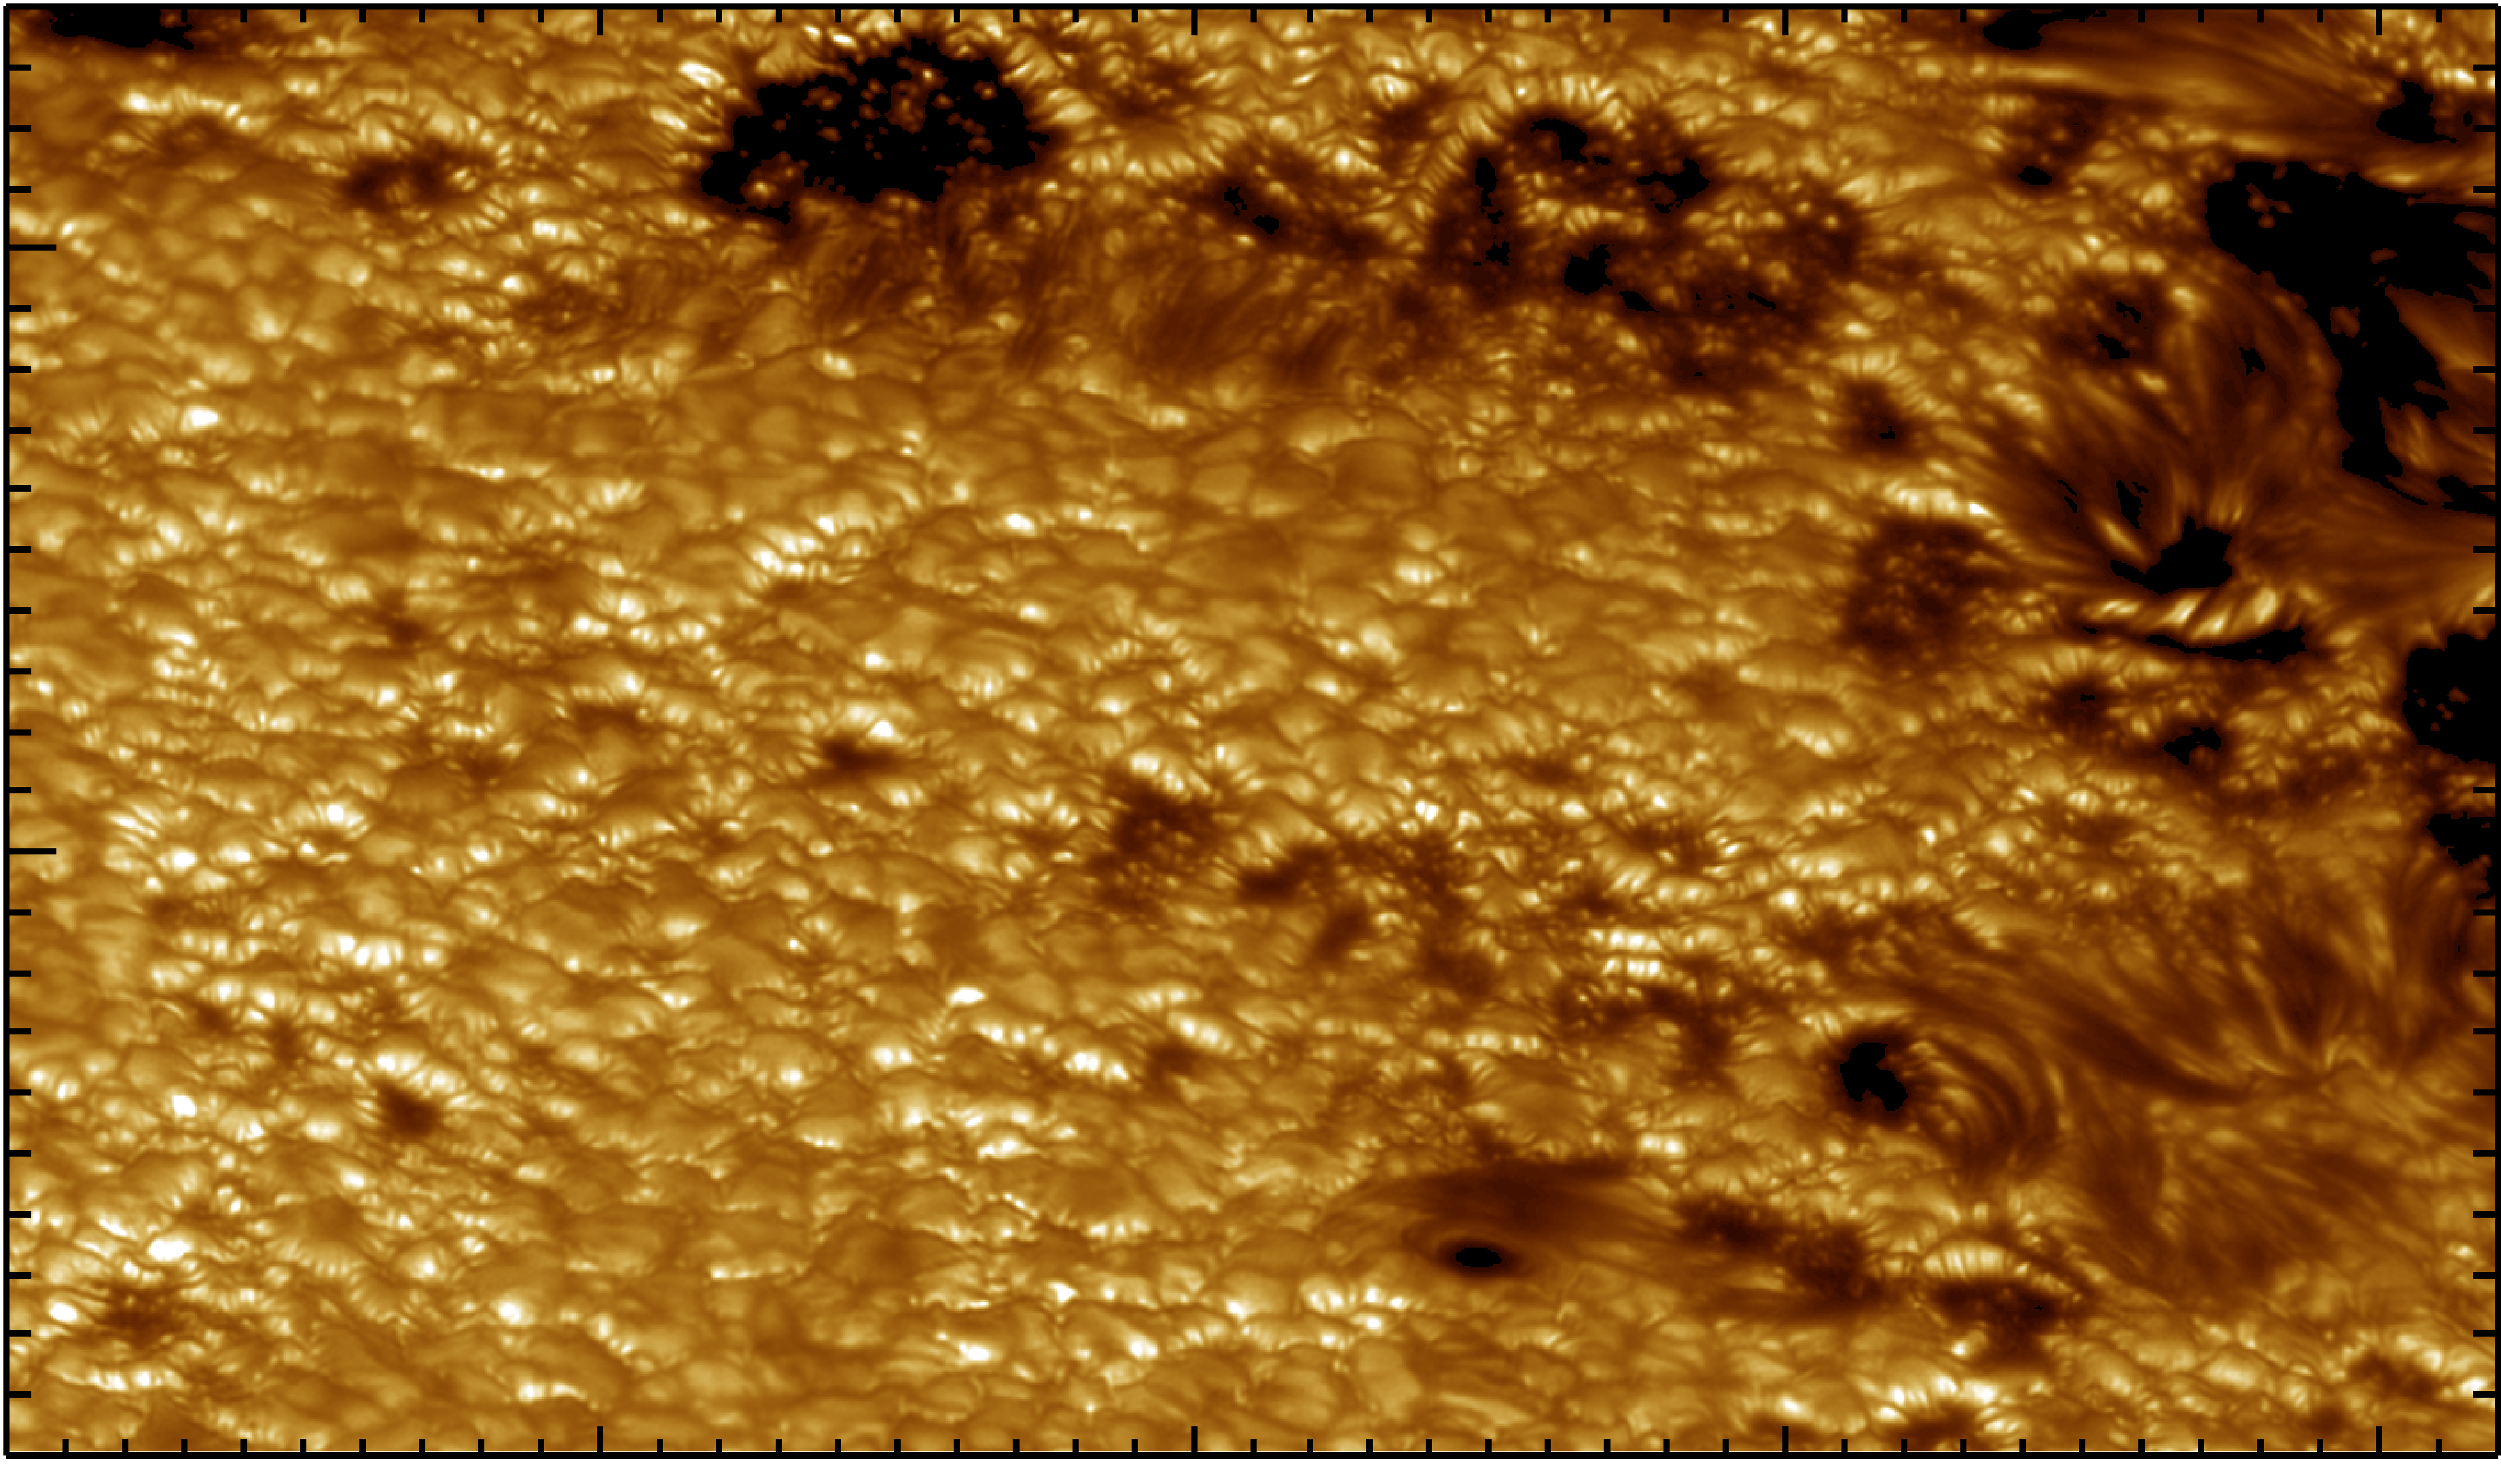
The top photo on the right side of this page comes from the
folks at Lockheed Martin, the National Center for Atmospheric Research, The
Institute of Theoretical Astrophysics of the University of Oslo, and the
Institute for Solar Physics of the Royal Swedish Academy of Sciences. A news
article about these closeup photos of the photosphere can be found
here and
additional information and photos can be found
here.
I would also like to thank Stein Vidar Hagfors Haugan at NASA
for taking the time to PATIENTLY (that is the part I appreciated) explain to me
the process used in creating "running difference images". In no way do I
mean to suggest that Mr. Haugan supports or endorses the ideas I have presented
here in any way. I am simply grateful for his patient email responses to my
questions.
This is a good website by the physics department at Mephis.edu that explains
many of the basic capabilities of each satellite.
A comprehensive spectral analysis of the sun can be found
through the Serts program
and a detailed breakdown of the sun's various ion emissions and their
frequencies can be found
here.
An interesting bit of support of the solid surface model comes from the
spectral analysis of a "quiet" sun vs. an active sun. One of the few
differences between these active and quite times is the notable increase of
sulfur and nickel during the active phase which suggests volcanic or magma activity could
be involved in the active times, just as a solid surface model would predict.
It also records the presence of over 57 different types of ion emissions.
Any overly simplistic model of the makeup of the sun's various layers is
therefore doomed to be inadequate until we understand where each ion comes from
within each layer.
Future notions of astronomy will include a healthy respect for
the electrical currents flowing through our universe. Here are some links
to papers that have set the stage for a far more comprehensive understanding of
astrophysics:
The first link talks about the electromagnetic heliosheath that surrounds the
sun.
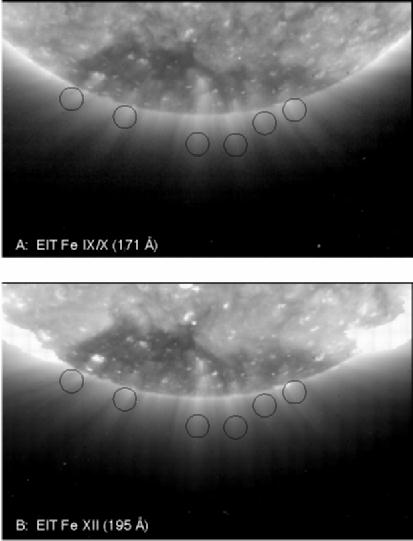
This link talks about the
observation of
solar plumes found in iron ion emissions. Here is another article
describing the observation of
high altitude
solar plumes. All of this confirms the work of
Kristian Birkeland.
The sun indeed has a solid surface that is very electrically active. His
lab results nearly mirror the observed behaviors of the sun on many levels.
It is clear that Kristian Birkeland set the groundwork for a far more
comprehensive understanding of our universe based on an "electric" universe
model.
I have
also run across some very interesting videos related to density and compositions
of liquid like bodies in space that may play a part in the overall "density" of
the sun.
You may download the original FITS files from the TRACE
program at this link.
The original 171A Lockheed Martin running difference image can
be found here.
Goddhard Space Flight Center Scientific Visualization Studio
can be found here.
|