|
The Sun - Assumptions, Observations And Early Interpretations
From the many conversations I've had
with people at NASA and Stanford and Lockheed Martin, and from the pictures I've downloaded at
Lockheed Martin Solar and Astrophysics Laboratory, I believe I can explain
why a few simple misconceptions have hampered recent research into the sun's
many layers.
The TRACE
project began with a very important scientific mission but it also began
with one very unfortunate assumption. The Trace satellite was
specifically designed to study the "transitional region" where temperatures
on the sun soar from thousands of degrees Kelvin up to millions of degrees
Kelvin. Because the 171A, 195A and
284A filters are sensitive to ionized iron plasma in the millions of
degree range, it was always "assumed" that this heat "transition" took place
between the twenty thousand degree chromosphere and the million plus degree
corona. This initial assumption naturally led to the belief that
every image returned from the iron ion spectrum on the Trace satellite were "most likely" coming from the area between the
chromosphere and the corona. This assumption was made even before the
satellites were launched. With only 2 dimensional images to work with,
it's difficult to falsify or confirm this assumption.
While it may
have
seemed like a logical premise at the time, unfortunately that initial
"assumption" was inaccurate from the start. This animation
from NASA demonstrates that the coronal loops, and
the heated plasma
contained within the coronal loops originates far beneath the visible
photosphere, not above it. Lockheed's preconceived assumption about
location of the transitional region has led to a lot of misconceptions at
NASA and Lockheed Martin that persist to this day. Recent evidence
from Lockheed Martin over the past few years would suggest that electricity
plays a very key and
vital role in coronal mass ejections. This suggests that
electricity rather than the corona is the likely heat source of these
emissions rather than the corona as Lockheed and NASA first "assumed".
Recent heliosiesmology
evidence from Stanford now confirms that a stratified layer exists at .995R
UNDERNEATH of the visible photosphere,
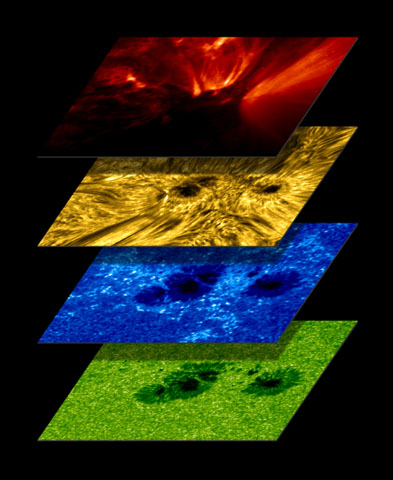
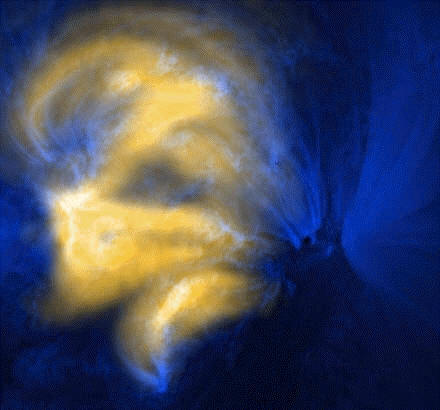
The various wavelengths
of light that are received by the various satellite and ground based
filters, reveals to us a very specific layer of the sun based on the physical composition
and structures that are seen in the images from this wavelength. From these
different filters and different wavelengths of light we can determine that there
are at least four distinct outer layers of the sun, each with it’s own
unique set of behavioral properties, photon emission patterns, unique defining characteristics and textures. Examples of these
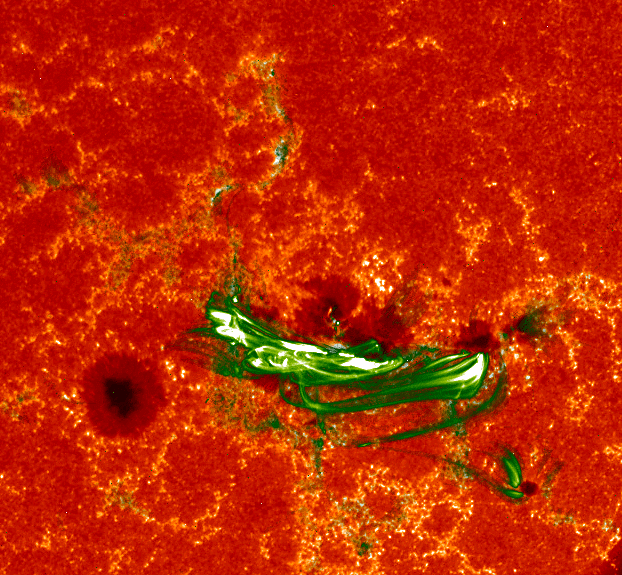
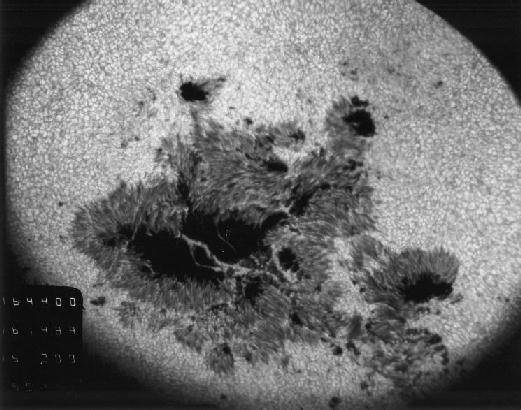
layers and textures can be seen in the top image on the right. The
first and second images are actually provided by Lockheed Martin and the
second one is arranged as Lockheed Martin and NASA believe them to be
ordered.
Three of these
layers are quite well known and studied. They have very unique and easily recognizable
"surfaces" and characteristics. For instance, the
granular surface of the
photosphere represented in the top two images in green, is well known and has been observed by
ground based telescopes for many years. This is the layer that emits
the bulk of the visible light we see. It emits
visible light through the penumbral filaments. We can even see the
side of these filaments along the side of
sunspots. The chromosphere (blue layer) is also well known
and easily recognizable by it's surface "texture". It emits photons in the helium ion spectrum.
Since this layer is both lighter and warmer than the photosphere, it sits
above the photosphere.
The thin hydrogen corona is also well documented and is shown in orange/red.
The
yellow layer however is far less understood and in the second image, it has
also misplaced in relationship to the other layers. This transitional
layer has only recently
(in the last decade)
been observed by the TRACE and SOHO satellites in the 171 and 195 and 284 angstrom
frequencies that are associated with emissions from iron ions.
Only in the past month
has heliosiesmology demonstrated a "transitional layer" that sits beneath
the visible photosphere.
Until that time this surface electrical activity was only seen in hydrogen ion
emissions. Now however, we can also image this same electrical
activity, and much of these same structures in iron ion emissions.
One of the first
things we must determine is what this layer is made of, and where it sits in
relationship to the other three, more easily recognizable and well
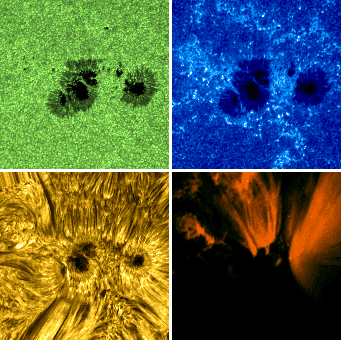
understood layers of the sun. The second photo on the right
represents the “official” ordering system that NASA, Stanford and Lockheed Martin use and work with. That ordering system is based upon the ASSUMPTION
on NASA's part that the photons
we see coming from the sun's arcs seen streaming from this layer MUST be “backlit” or illuminated from
underneath by the sun’s photosphere or coming from the surface of the
transitional layer itself. They also base this ordering
system on the assumption of Lockheed Martin that the heat associated with these emissions is
coming exclusively from the heat of the corona. That PRESUMPTION is only ONE
possibility. We must also allow for the possibility that the photons we see
coming from these arcs are emitted from WITHIN the arcs themselves, and these
particles are heated by the electrical activity rather than being
heated exclusively in the corona. Because NASA has always presumed that
the photons seen in these arcs must be coming up from underneath the arcs
rather than from inside them, and because they never expected to find a solid
surface on the sun, they have inaccurately ordered this
layer of the sun that is designated in yellow. I believe I can demonstrate
that error rather convincingly.
To start with, it is important to
understand that these light we see comes from atoms of iron, or more
specifically ions of iron plasma. The 171 and 195 and 284 angstrom
filters are specifically designed to "see" photons emitted by a very
specific types of ionized atoms, namely energetic forms of iron ferrite,
specifically
Fe IX, X, XII and
XV. These same filters are also sensitive to
Calcium ions in the 4 million degree range as well as Fe XX emissions in the
10-20 million degree range as well. This wide range of temperature
sensitivity precludes the dark areas of these images from being "hotter"
than the lit areas. The
SERTS space program has also
documented the entire range of ferrite ion emissions, not to mention ions
from calcium magnesium, chromium, manganese, aluminum, silicon, neon, and helium
from these arcs.
In
addition, the University of Maryland has documented temperature extremes of
over 1000 Million (1 Billion US) degrees.
Ferrite is a magnetic form of iron and
as we all know, iron is a MUCH heavier material than the hydrogen, helium,
neon, silicon and calcium layers of photosphere and chromosphere and
corona. If atoms of iron are being ripped from the
surface in solar moss activity and ionized in the electrical arc, then
gravity alone would suggest such a heavy iron layer would simply SINK to the
bottom, not float ABOVE lighter plasma layers. This seems like the
most damaging piece of evidence against the "official" ordering system.
The fact we see coronal rain in these images also suggests that the iron
plasma falls back to the surface once the arc ceases.
It's also rather difficult to imagine
how visible light travels from the photosphere could somehow manage to travel
THROUGH a structured layer of calcium ferrite material (think refrigerator
magnet) to
somehow reach us here on earth. It's also hard to fathom what keeps
the iron layer cool enough to form a structured surface between the
chromosphere and corona with structure that persists over days, and rotates
uniformly to boot.
Lockheed Martin suggests that the heat from the
corona is responsible for the iron ion emissions based on the fact that
temperatures of over a million degrees are required in order for us to be to
able to see these kinds of iron ion emissions. If however we look at the
relative distribution of heat up close, we can see that the heat which
releases these photons comes not from around the iron loops but from within
them. This implies that electrical activity within the arc itself is
responsible for the heat and the iron ion emissions.
The electrical
arcs produce the heat that releases these photons, not the corona, otherwise
the area around the arcs would be hotter than the arcs themselves. If
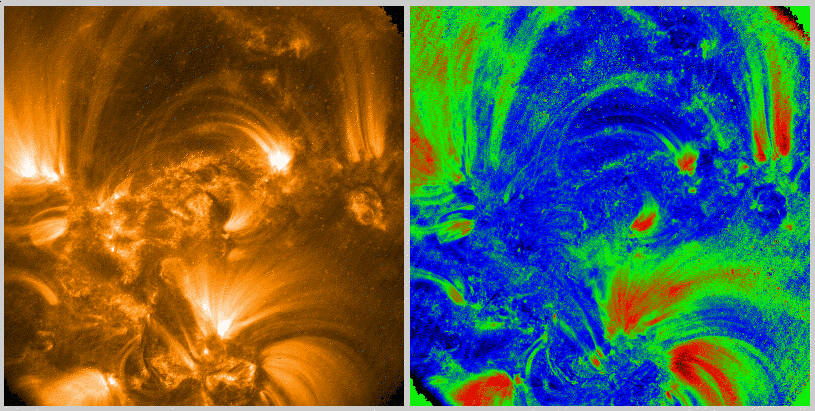
we look at the next image that compares the 171 angstrom view of the
surface with the heat distribution patterns related to this activity, it's
clear that the surface of this iron layer is much cooler than the iron
within the arc itself. The areas of greatest electrical activity
correspond to the areas with the greatest amount of heat present. This
is exactly the opposite of what we would expect to see if the corona was the
heat source for these emissions. In such a scenario, we would expect
to see the area around the arcs and around this layer to be HOTTER than the
arcs themselves and much hotter than the iron layer. That is not what
we see. The surface is dark. A quick reality check here also
reveals that if the dark surface was truly a million degrees, black body
mathematics suggest that a black body the size of the sun heated to a
million degrees would constantly emit 3.45 X 10^35 watts or joules per
second. Now let us compare this number to
Wikipedia’s OOM calculation of the solar output: 3.827 × 10^26 joules
per second. That is about nine orders of magnitude too high!
If however we plug in the actual temperature of the photosphere into those
dark areas (5800K) for purposes of our black body energy calculation, we
come up with the "correct" order of magnitude number for solar output.
The dark regions of the original 171A image therefore cannot be hotter than
the brightest areas in the image or we would all be fried to a crisp!
Instead of a seeing a relatively hot background
against a cooler arc and cooler surface, we find a heated arc within a
cooler environment and find a surface that is relatively cool. This is
exactly the opposite condition of what Lockheed Martin's layering system
would predict and exactly backwards of Lockheed Martin's own explanation of
this image. If the blue surface was hotter than the arc, then the blue
areas would be lit up in bright white in the left hand image. Instead
the red and green areas correspond to the brightest shades and therefore
indicate the areas of greatest temperature. Evidently Lockheed Martin
does not fully appreciate the physics and implications of black body radiation. The
brightest areas of any black body represent the hottest temperatures.
The fact the surface is dark in both Trace and Yohkoh satellites means the
surface is cool. In fact we already know that the surface of the
photosphere is only 6000K, much too cold to emit iron ion photons in this
wavelength. Only the iron in the arc itself is heated to millions of
degrees.
The work of
Nicklas Eckland promises to answer the question of this layer's surface
composition. The presence of calcium in the chromosphere suggests that the
surface ferrite is likely to be a type of calcium ferrite with whatever
other impurities (magnesium, chromium, manganese, aluminum) might be useful in keeping the
structure stable in these temperature ranges.
The photosphere certainly acts as a heat sink, drawing heat away from the
bottom and bringing it to the surface. That part is already known and
documented. The only thing that remains to be answered is how "cool" is the
bottom of the photosphere and how high is the melting point of these types
of calcium ferrites considering the gravity and magnetic field conditions on
the surface of the sun.
Nicklas Eckland's work suggests that it might be
possible to explain a consistent and organized calcium ferrite surface that
sustains itself as a solid structure in an environment where temperatures
soar to upwards of two to three thousand degrees.
These are conditions which might exist at the BOTTOM of the
photosphere. However, it is nearly impossible to explain how such a
solid ferrite
surface could exist in an environment that is upwards of twenty thousand degrees
as the
"official" ordering system would require!
Our next piece of evidence relates the longevity of
this particular layer in comparison the other layers of the sun. The
photosphere and chromosphere are VERY active layers, composed primarily by
hydrogen and helium plasma. These layers change very dramatically over
the span of a few minutes. Ferrite materials on the other hand tend to be far
more "stable", more rigid, more resistant to heat, and less apt to change rapidly from one moment to
the next. This layer is very active however as the solar moss
videos demonstrates. Even still, this layer can be VERY stable, over a
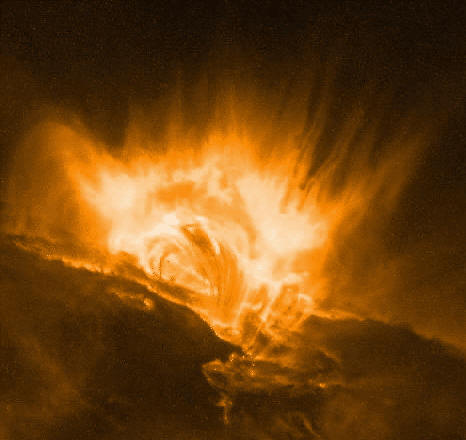
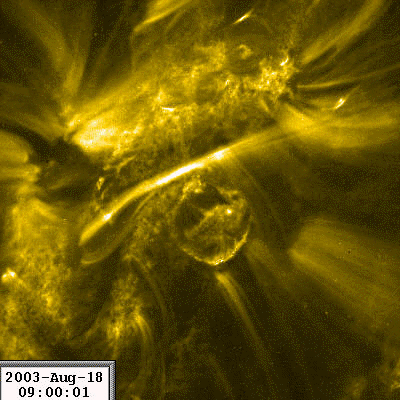
very long period in solar terms. The third and forth yellow photos on the right were
taken with the 171 angstrom filter. This layer is represented in the
top image as the yellow layer. Here is a video of this layer, and the activity found on this layer using
the 171 angstrom filter, that is processed through the running difference
imaging technique.
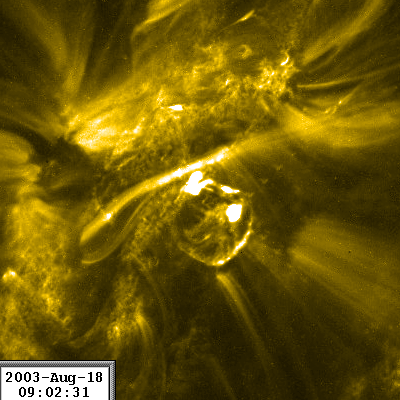
On the right, near the bottom of the
page, we see two individual
snapshots using the 171A filter that were taken two minutes and thirty
seconds apart. In the center of each photo we can see the clear outlines of
a crater shaped structure that has changed very little during that two and
half minutes. In fact very little about the underlying structures on this
surface has changed much during this two and half minutes. In solar terms,
two and a half minutes is virtually an eternity. The suns upper layers are
VERY dynamic. The crusty upper layers of the light chromosphere, and
granular surface of the photosphere change RAPIDLY and dynamically and do
not resemble these solid looking surfaces. Whatever surfaces these
structures represent, they are not related to the chromosphere or the
photosphere, and NASA already knows this since it designates this layer
individually. This type of continuity of structure over a two and a half
minute timeline is simply not found in the light-liquid-like upper layers of the
photosphere and chromosphere. These layers are gas plasma layers that are constantly
in flux and change rapidly over time. Only the surface layer itself has
that kind of stability, and even for the surface itself two minutes and
thirty seconds can be a very long time indeed!
Another clue that there is a serious
problem with the official ordering system comes from the Yohkoh satellite. The “solar moss” image
on the home page of this website was created by overlaying the 171 angstrom
images from the TRACE satellite with YOHKOH’s x-ray view of this same
event. There are three distinct “layers” shown in this photo. There is the
bottom layer that shows the solar moss and is the "surface" (represented in
yellow in the upper image) that emits the arcs, and sits at the
base of the arcs. There is then a “cooler” blue region that the arcs
traverse where the arcs do not emit x-rays, followed by a higher energy
state layer where the arcs emit x-rays and become visible to Yohkoh and
appear in yellow.
This image demonstrates that the
ordering system that NASA uses is simply wrong. We can see in this image that the
solar moss is the BOTTOM surface layer from which the arcs originate. The
arcs travel through the cooler, thicker blue layer of the photosphere during which
time they are not visible by Yohkoh. As these arcs pass from the
thicker layer of the photosphere into the thinner, hotter chromosphere,
they pick up heat and begin to emit soft x-rays that YOHKOH can see. If the
solar moss layer sat above the photosphere as NASA believes, we would not
have two more distinct layers of the sun for these arcs to pass through. If
however the solar moss surface is actually the bottom surface of the sun,
then these photos make complete sense. The arcs pass through the cool,
thick
medium of the photosphere, and then “heat up” rather dramatically as they
pass into the hotter chromosphere. That photo clearly demonstrates the error in
NASA's ordering system.
The second major misconception involves
Doppler imaging and the concept of moving mass and how moving mass reflects
off solid surfaces in Doppler images. The Doppler imaging systems that NASA
is using are fully capable of showing us not just two dimensions as is
presumed in a gas model but can in fact show all three dimensions from a
solid surface. Because NASA ASSUMES that the sun has no solid surface to
reflect back Doppler images, it simply isn’t looking for such patterns in
these images. The tsunami video is produced by the Doppler imaging systems
onboard SOHO. It clearly reveals a SOLID, irregular shaped surface
structure below the liquid-plasma layer of the photosphere. We can and do
see a flat ridge with jagged sides that is consistent from frame to frame in
these Doppler images. This structure blocks the moving mass used in Doppler
images around the outlined areas. That is only possible if there is
something SOLID to block moving mass at that point. Many surface images are
taken using Doppler imaging, and the sun's hard surfaces are in fact visible
in the tsunami video based on Doppler images. This video also demonstrates
that NASA ordered these layers incorrectly because something hard can be
seen BELOW the photosphere that the wave is propagating through. The
photosphere simply CANNOT be the bottom layer and this video offers us
direct proof of that.
The last misconception involves the
scientific tradition. The gas model concept came about based on Galileo's
very limited visual OBSERVATIONS, OBSERVATIONS that were done four centuries
ago using a very rudimentary telescope. Since that time the scientific
community has tried and failed to explain the sun's activities using the gas
model given to us by Galileo. In all that time however, it has never fully
explained the arcs from the sun, the cause of solar flares, the cause of the
changing sunspots, solar moss, the suns 11 year sunspot cycle, etc.
Everything I have presented on this
website is based entirely on OBSERVATION from six different multi-million
dollar satellite systems as well as from ground based observations and
spectral analysis from the SERTS program. With a
solid surface model I can and have explained a LOT of what goes on in the
sun, far better than I could ever explain the sun's behaviors while I clung
to scientific tradition and the gas model theory of the sun.
Once I let OBSERVATION be my one and only guide, and
I trusted in the
technology of these satellites, everything changed. I found by observation,
a model that can and does explain the behaviors of the sun quite well. I
therefore believe that a solid surface model is a FAR SUPERIOR model than
the current gas model, a model that is 400 years old and has managed to
explain virtually nothing about the inner workings of the sun.
Please consider the following: I have
spent a great deal of time and effort to explain a whole range of phenomenon
related to the sun's activities on this website. I did this to demonstrate
that a solid surface model is a GOOD model, and a WORKING model that offers
us real explanations for what we observe. This is a sound scientific model
that is based entirely and completely on OBSERVATION, the same kind of
observations that Galileo made. The difference between our different
sets of observations is 400 years of technological progress, and millions of
dollars in high tech satellite imaging systems.
The gas model of the sun, though a
wonderful theory has yet to be verified or validated by direct observation
of real world satellite imagery of the sun. The gas model has yet to
offer any predictive capabilities of the sun, even after 400 years of efforts by untold
numbers of very educated, dedicated and intelligent scientists. What should that tell
us about the gas model and it's usefulness as an explanatory device? If a solid surface model can be
supported by observation, and can explain the phenomenon that we see with great accuracy,
why should scientists cling to a failed model, only because it's considered "acceptable" to
the scientific community? The gas model is to day, simply a theory.
Whether or not this theory actually applies to "reality" and to a real sun
depends on it's ability to explain the images you see before you.
These are observations in the truest scientific sense.
|
